Java Heap Dump Analysis using Eclipse Memory Analyzer (MAT)
In this article we will learn what a Java heap dump is and how to analyze a heap dumps generated through OutOfMemoryError using Memory Analyzer in Eclipse.
What is a heap dump?
A heap dump is a snapshot of memory at a given point in time. It contains information on the Java objects and classes in memory at the time the snapshot was taken.
Why would we want to read heap dump?
If your Java application crashes with an OutOfMemoryError it is possible to automatically get a heap dump to analyze. This view into the memory profile of the application at the time it crashed can help us to figure out what caused the error. This can help decide what to optimize in our code.
How to get a heap dump?
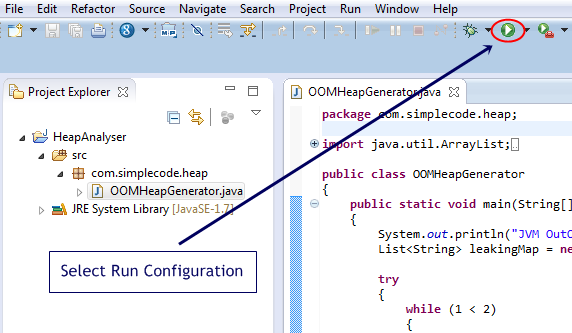
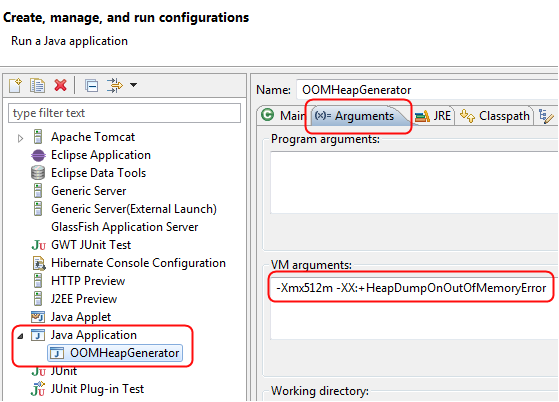
To generate heap dump we have to execute a JVM with the following parameters in eclipse
-XX:+HeapDumpOnOutOfMemoryError writes heap dump on first OutOfMemoryError
Here the heap dump will be generated in the “current directory” of the JVM by default. It can be explicitly redirected with
-XX:HeapDumpPath= for example -XX: HeapDumpPath=/disk/myFolder.
How to read a heap dump?
Heap dump will be in binary format so you don’t read the plain file. Instead use a tool like Memory Analyzer Tool.
Download MAT plugin from this location, and install it in your eclipse.
OOM Java program
Here the Java program below is used to trigger an OutOfMemoryError. This program is basically creating multiple String instances within a List data structure until the Java Heap depletion.
package com.simplecode.heap;

import java.util.ArrayList;
import java.util.List;

public class OOMHeapGenerator
{
public static void main(String[] args)
{
	System.out.println("JVM OutOfMemoryError Simulator");
	List leakingVariable = new ArrayList();

	try
	{
		while (1 < 2)
		{
		leakingVariable.add("OutOfMemoryError");
		}
	}
	catch (Throwable exp)
	{
	     if (exp instanceof java.lang.OutOfMemoryError)
	     {
	     System.out.println("OutOfMemoryError triggered! " + "[" + exp + "]");
	     }
	     else
	     {
	     System.out.println("Other Exception! " + "[" + exp + "]");
	     }
	}
	System.out.println("Simulator done!");
}
}
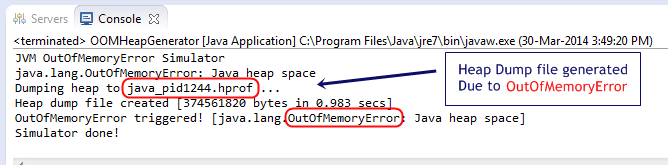
On running this program, when the JVM ran out of memory it created a heap dump file java_ pid1244.hprof.
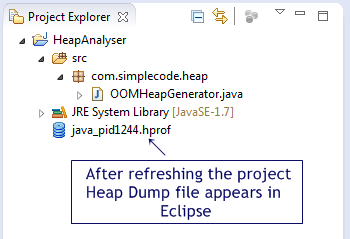
Press F5 in your project folder, so now the generated heap dump file will appear in eclipse.
Load Heap Dump
Just double click on the heap dump file and select the Leak Suspects Report, and then this file will be loaded into MAT.
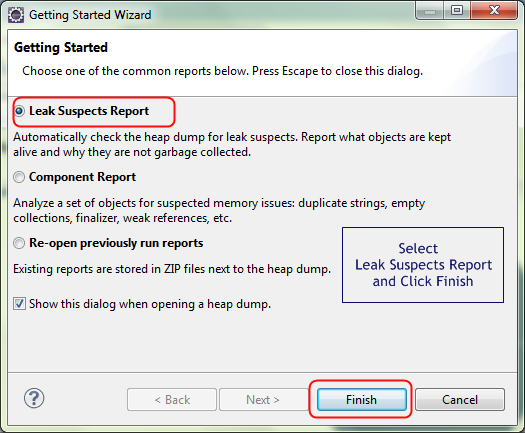
On clicking finish the following Screen is obtained
Analyze Heap Dump
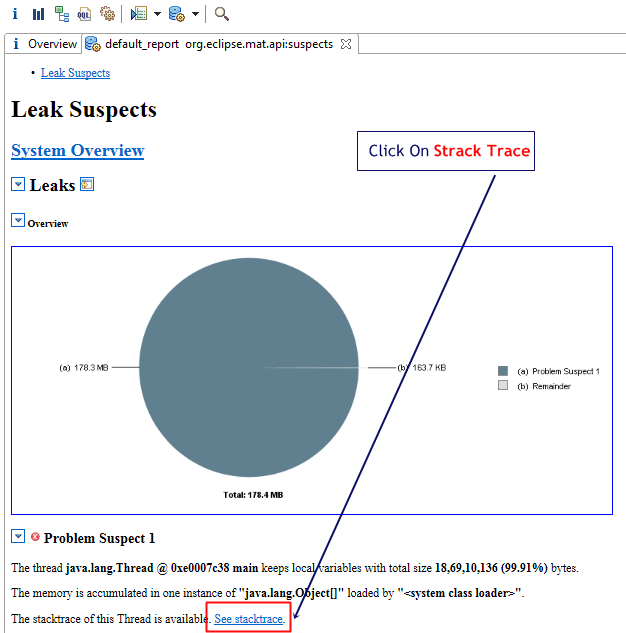
Clicking on the “See stacktrace” link will give you the exact line of code that was building up the huge List causing the application to crash.
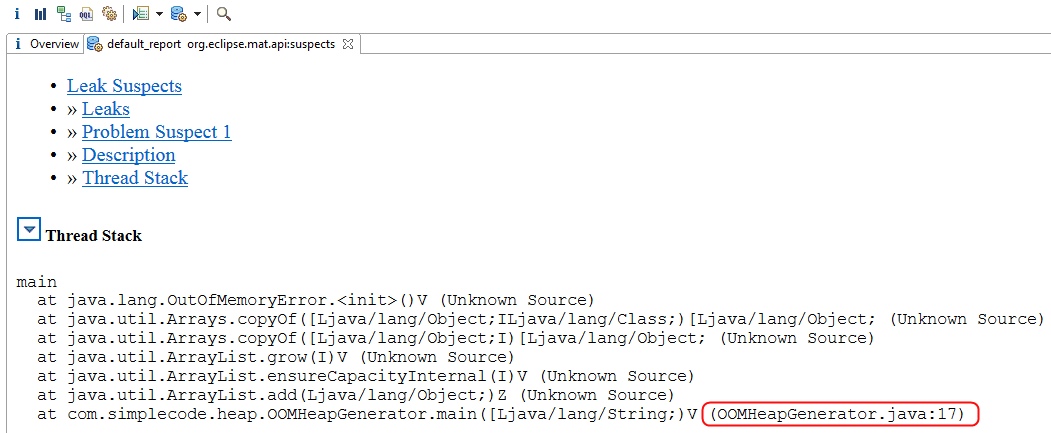
Now we know where to go look in at the code to fix this bug. Hence by analysing the Heap Dump using the MAT we could easily identify our primary leaking Java class and data structure.
wonderful article, thanks for writing :) was looking for simple way to analyze heap dump.