Pie Chart using YUI3 jquery chart plugin in Java web application
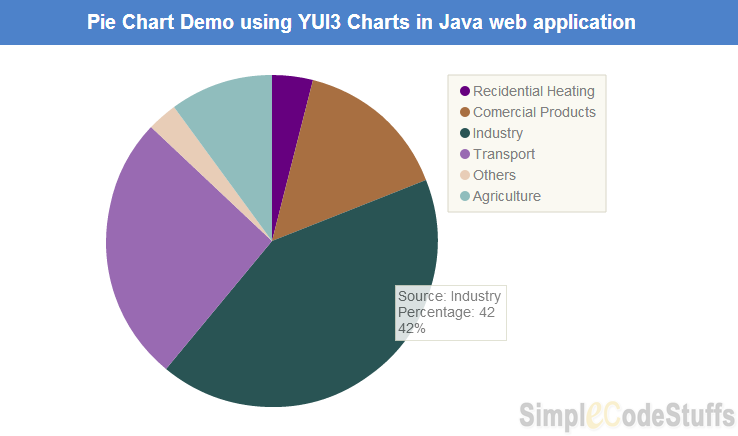
In this article we will learn to create a pie chart in Servlet with YUI3 jquery chart plugin and this demo is as follows
YUI3 provides a “charts” module for creating a wide variety of good looking charts, this module can be called using use() method. These charts requires input data to be in JSON format. For more Information on YUI3 chart, read on its official document – http://yuilibrary.com/yui/docs/charts/
Recommended reading
Create Auto-Refreshing Pie Chart/Bar Chart in Servlet dynamically using JFreeChart
In this example, I am going to retrieve values from a csv file insted of database and display its data in from of pie chart, for this, I am going to use OpenCSV library which simplifies the work of parsing CSV files. Here the Data table will load the data by making an Ajax call.
Note:
• Refer the article on how to Read / Write CSV file in Java using Opencsv library/ .
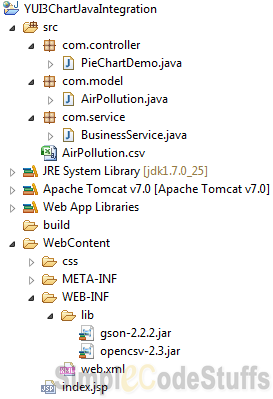
Download the csv file from which the data is to be read from here and place it under src folder. This csv files contains 2 columns – Source and Percentage.
Final folder structure is as shown below
Model class
Create a model class that gets and sets the data from the columns of the csv file.
package com.model;

public class AirPollution {

	private String Source;
	private int Percentage;

	public AirPollution() {
	}

	public AirPollution(String source, int percentage) {
		Source = source;
		Percentage = percentage;
	}

	public String getSource() {
		return Source;
	}

	public int getPercentage() {
		return Percentage;
	}

	public void setSource(String source) {
		Source = source;
	}

	public void setPercentage(int percentage) {
		Percentage = percentage;
	}
}
Business class
Create a Business Service class that would fetch data from the csv file using model class.
BusinessService
package com.service;

import java.io.BufferedReader;
import java.io.IOException;
import java.io.InputStream;
import java.io.InputStreamReader;
import java.util.LinkedList;
import java.util.List;

import au.com.bytecode.opencsv.CSVReader;

import com.model.AirPollution;

public class BusinessService {

public static List getAirPollutionSource() {

	List airPollutionList = new LinkedList();
	String fileName = "AirPollution.csv";

	InputStream is = Thread.currentThread().getContextClassLoader()
			.getResourceAsStream(fileName);
	BufferedReader br = new BufferedReader(new InputStreamReader(is));

	try {
		CSVReader reader = new CSVReader(br,',','\"',1);
		String[] row = null;
		while ((row = reader.readNext()) != null)
		{
		airPollutionList.add(new AirPollution(row[0], Integer.parseInt(row[1])));
		}
		reader.close();
	} catch (IOException e) {
		System.err.println(e.getMessage());
	}
	return airPollutionList;
}
}
Also read
Struts2-Jfreechart integration
Jsp page
Now create the jsp file to display the data fetched from csv file in form of pie chart.
Pie Chart using YUI3 Charts in Java web application Pie Chart Demo using YUI3 Charts in Java web application
Controller
package com.controller;

import java.io.IOException;
import java.util.List;

import javax.servlet.ServletException;
import javax.servlet.http.HttpServlet;
import javax.servlet.http.HttpServletRequest;
import javax.servlet.http.HttpServletResponse;

import com.google.gson.Gson;
import com.google.gson.GsonBuilder;
import com.model.AirPollution;
import com.service.BusinessService;

public class PieChartDemo extends HttpServlet {
	private static final long serialVersionUID = 1L;

	protected void doGet(HttpServletRequest request,
			HttpServletResponse response) throws ServletException, IOException {

		response.setContentType("application/json");
		// Call business service class to get list of Air Pollution Source
		List airPollutionList = BusinessService.getAirPollutionSource();

		Gson gson = new GsonBuilder().setPrettyPrinting().create();
		// Convert Java Object to Json
		String json = gson.toJson(airPollutionList);

		response.getWriter().print(json);
	}

	protected void doPost(HttpServletRequest request,
			HttpServletResponse response) throws ServletException, IOException {
		doGet(request, response);
	}
}
Web.xml
Make sure you have done servlet mapping properly in web.xml file as shown below
    index.jsp


    PieChartDemo
    PieChartDemo
    com.controller.PieChartDemo


    PieChartDemo
    /PieChartDemo

hi , i am new to ajax/json etc. i am trying to use the above code to create a pie chart, but getting the error:
SyntaxError: JSON.parse: unexpected end of data at line 1 column 1 of the JSON data
[ data = JSON.parse(response.responseText)]
can you please help