
Struts2-Jfreechart integration
In this article we will learn to integrate Struts 2 with JFreeChart using struts2-jfreechart-plugin-x.x.x.jar for creating a pie chart in web application using JFreeChart library.
The JFreeChart is easiest and the most widely used library for creating a wide variety of good looking charts.
The Struts-JFreeChart plugin allows Struts 2 Actions to easily return generated charts and graphs.
Instead of streaming a generated chart directly to the HTTP response, this plugin provides a ChartResult, which handles the generation for you. This allows you to generate the chart in one class, and render it out in another class, effectively decoupling the view from the Actions.
** UPDATE: Struts 2 Complete tutorial now available here.
Libraries required :
- struts2-jfreechart-plugin-x.x.x.jar
- Commonly required Struts 2 jars
- jfreechart-x.x.x.jar
- jcommon-x.x.x.jar
Jfreechart library can be downloaded here.
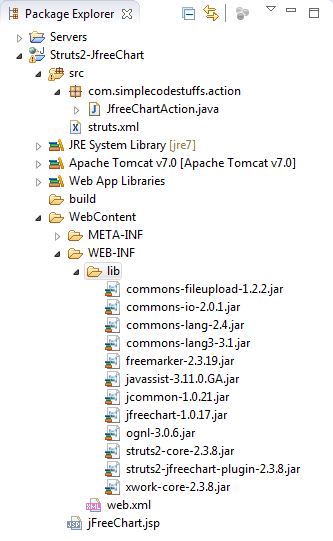
Now Create a New Dynamic Web Project in eclipse with following folder structure
Struts 2 Action
File : JfreeChartAction.java
package com.simplecodestuffs.action;
import org.jfree.chart.ChartFactory;
import org.jfree.chart.JFreeChart;
import org.jfree.data.general.DefaultPieDataset;
import com.opensymphony.xwork2.Action;
public class JfreeChartAction implements Action {
private JFreeChart chart;
public String execute() throws Exception {
DefaultPieDataset dataSet = new DefaultPieDataset();
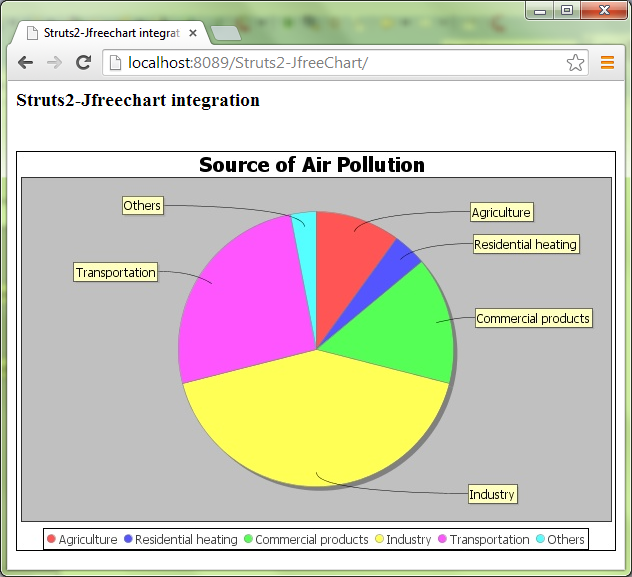
dataSet.setValue("Agriculture", 10);
dataSet.setValue("Residential heating", 4);
dataSet.setValue("Commercial products", 15);
dataSet.setValue("Industry", 42);
dataSet.setValue("Transportation", 26);
dataSet.setValue("Others", 3);
chart = ChartFactory.createPieChart(
"Source of Air Pollution ", // Title
dataSet, // Data
true, // Display the legend
true, // Display tool tips
false // No URLs
);
chart.setBorderVisible(true);
return SUCCESS;
}
// This method will get called if we specify <param name="value">chart</param>
public JFreeChart getChart() {
return chart;
}
}
Recommended reading:
Here Jfreechart provides DefaultPieDataset method to set static data and createPieChart() method creates the pie chart using the dataset.
struts.xml
To use the plugin, have your Struts configuration package extend the jfreechart-default package, which provides the chart result type.
<?xml version="1.0" encoding="UTF-8" ?>
<!DOCTYPE struts PUBLIC
"-//Apache Software Foundation//DTD Struts Configuration 2.0//EN"
"http://struts.apache.org/dtds/struts-2.0.dtd">
<struts>
   <!-- package should extend jfreechart-default package -->
   <package name="default" namespace="/" extends="jfreechart-default">
       <action name="displayChart" class="com.simplecodestuffs.action.JfreeChartAction">
            <result name="success" type="chart">
		<param name="value">chart</param>
		<param name="type">jpeg</param>
		<param name="width">600</param>
		<param name="height">400</param>
	    </result>
	</action>
   </package>
</struts>
Jsp page
<html>
<head>
<title>Struts2-Jfreechart integration</title>
</head>
<body>
     <h3>Struts2-Jfreechart integration</h3>
     <br />
     <img src="displayChart"/>
</body>
</html>
In Jsp, servlet is called via img tag’s src attribute. This triggers the Action and render the image on the page.
** UPDATE: To Create Auto-Refreshing Pie Chart dynamically the following tutorial will help here.
Demo
Now right click on the project name and select Run As –> Run on Server.

Auto-Refreshing Pie Chart/Bar Chart in Servlet dynamically using JFreeChart
In this post, we’ll learn to create a pie chart using JFreeChart that can be returned as an image from a servlet. Here, I have created the pie chart using the values retrieved from database and display it in JSP. In order to sync the pie chart with values from a database that is frequently updated, I have written auto-refresh script which refresh the page automatically at regular intervals.

Libraries required :
jfreechart-x.x.x.jar
jcommon-x.x.x.jar
Download Jfreechart library from here.
Now let us create a sample table called ‘air_pollution’ in oracle database, that consists of the factors which causes air pollution and its percentage of emission.
create table air_pollution(source varchar(50), percentage int)
Here is the data contained in the above table

Now Create a New Dynamic Web Project in eclipse with following folder structure

Servlet
File : PieChartServlet.java
package com.simplecodestuffs.action;

import java.io.IOException;
import java.io.OutputStream;
import java.sql.Connection;
import java.sql.SQLException;

import javax.servlet.ServletException;
import javax.servlet.http.HttpServlet;
import javax.servlet.http.HttpServletRequest;
import javax.servlet.http.HttpServletResponse;

import org.jfree.chart.ChartFactory;
import org.jfree.chart.ChartUtilities;
import org.jfree.chart.JFreeChart;
import org.jfree.data.jdbc.JDBCPieDataset;

import com.simplecodestuffs.jdbc.DataAccessObject;

public class PieChartServlet extends HttpServlet {
	private static final long serialVersionUID = 1L;
	private Connection dbConnection = null;

	public PieChartServlet() {
		dbConnection = DataAccessObject.getConnection();
	}

	public void doGet(HttpServletRequest request, HttpServletResponse response)
			throws ServletException, IOException {
		JDBCPieDataset dataSet = new JDBCPieDataset(dbConnection);

		try {
		dataSet.executeQuery("SELECT SOURCE,PERCENTAGE FROM AIR_POLLUTION ORDER BY PERCENTAGE");
		JFreeChart chart = ChartFactory.createPieChart(
		 "Source of Air Pollution ", // Title
	         dataSet,                    // Data
	         true,                       // Display the legend
	         true,                       // Display tool tips
	         false                       // No URLs
		 );

		if (chart != null) {
         		chart.setBorderVisible(true);
			int width = 600;
			int height = 400;
			response.setContentType("image/jpeg");
			OutputStream out = response.getOutputStream();
			ChartUtilities.writeChartAsJPEG(out, chart, width, height);
		}
		}
		catch (SQLException e) {
			System.err.println(e.getMessage());
		}
	}
}
Recommended reading:
Here Jfreechart’s JDBCPieDataSet method is used to retrieve data from database and createPieChart() method creates the pie chart with the populated dataset. writeChartAsJPEG() method is responsible for rendering the image in jpeg format.
Note :
If you want the pie chart generated to be in PNG format, then writeChartAsPNG() method can be used.
DAO Class
Create utility class which connect to database Using Oracle JDBC driver
package com.simplecodestuffs.jdbc;

import java.sql.Connection;
import java.sql.DriverManager;

public class DataAccessObject {
	private static Connection connection = null;

	public static Connection getConnection() {
		if (connection != null)
			return connection;
		else {
			// Store the database URL in a string
		String serverName = "127.0.0.1";
		String portNumber = "1521";
		String sid = "XE";
		String dbUrl = "jdbc:oracle:thin:@" + serverName + ":" + portNumber
				+ ":" + sid;
		try {
		Class.forName("oracle.jdbc.driver.OracleDriver");
		// set the url, username and password for the database
		connection = DriverManager.getConnection(dbUrl, "system", "admin");
		} catch (Exception e) {
			e.printStackTrace();
		}
		return connection;
	}
	}
}
Web.xml
Make sure you have done servlet mapping properly in web.xml file as shown below
<servlet>
   <servlet-name>PieChartServlet</servlet-name>
   <servlet-class>com.simplecodestuffs.action.PieChartServlet</servlet-class>
</servlet>
<servlet-mapping>
   <servlet-name>PieChartServlet</servlet-name>
   <url-pattern>/displayChart</url-pattern>
</servlet-mapping>
<welcome-file-list>
   <welcome-file>pieChart.jsp</welcome-file>
</welcome-file-list>
Auto refresh Jsp
<!DOCTYPE html>
<html>
<head>
<title>Pie Chart Demo</title>
<script type="text/javascript">
	function refreshPage()
	{
		document.forms.formId.submit();
	}
</script>
</head>
<body>
	<h3>Create Pie Chart Dynamically using JFreechart</h3>
	<%
		response.setIntHeader("Refresh", 10);
	%>
	<form id="formId">
	   <input type="button" onclick="refreshPage()" value="Refresh Page" />
	   <br /> <img src="displayChart" />
	</form>
</body>
</html>
In Jsp, servlet is called via img tag’s src attribute, this triggers the servlet and render the image on jsp.
To automate the page refreshing process, the following code is used
response.setIntHeader("Refresh",10);
It will reload the current request after the given amount of seconds, as if you’re pressing F5. Here I set the time interval to 10 seconds, So the page will refresh and render updated data from database for every 10 seconds, this value can be set based on your requirement.
Note :
This automatic refreshing can cause a considerable performance impact since it hits database for every 10 second, so it is a good practice to have a ‘Refresh’ button to enable the end-users to decide on when to refresh the page.
Demo
Now right click on the project name and select Run As –> Run on Server.

Similarly to Create bar chart, replace the doGet method in the Servlet with the following code.
public void doGet(HttpServletRequest request, HttpServletResponse response)
		throws ServletException, IOException {
	JDBCCategoryDataset dataset = new JDBCCategoryDataset(dbConnection);

	try {
	dataset.executeQuery("SELECT SOURCE,PERCENTAGE FROM AIR_POLLUTION ORDER BY PERCENTAGE");

	JFreeChart chart = ChartFactory.createBarChart(
               "Source of Air Pollution", "Scource", "Percentage",
               dataset, PlotOrientation.VERTICAL, false, true, false);
               chart.setBorderVisible(true);

	if (chart != null) {
		int width = 600;
		int height = 400;
		response.setContentType("image/jpeg");
		OutputStream out = response.getOutputStream();
		ChartUtilities.writeChartAsJPEG(out, chart, width, height);
	}
	}
	catch (SQLException e) {
		System.err.println(e.getMessage());
	}
}
Demo
Bar chart – demo

Reference
- JFreeChart.org
- Set JFreeChart data from database
- What is the meaning of response.setHeader(“Refresh”, “300”)?
Read More